27th ICPC
ICPC 2003
Beverly Hills, United States · 10 problems
- 1University of Warsaw · Warsaw EaglesAndrzej Gasienica-Samek, Krzysztof Onak, Tomasz Czajka9
- 2Moscow State University · MSUEugeny Cherepanov, Maxim Babenko, Petr Mitrichev8
- 3St. Petersburg Institute of Fine Mechanics & Optics · SPb IFMOAlexander Shtuchkin, Eugene Yuzhakov, Timofey Borodin7
Problems
10 problemsProblem A · Building Bridges Input File: bridges.in
The City Council of New Altonville plans to build a system of bridges connecting all of its downtown buildings together so people can walk from one building to another without going outside. You must write a program to help determine an optimal bridge configuration.
New Altonville is laid out as a grid of squares. Each building occupies a connected set of one or more squares. Two occupied squares whose corners touch are considered to be a single building and do not need a bridge. Bridges may be built only on the grid lines that form the edges of the squares. Each bridge must be built in a straight line and must connect exactly two buildings.
For a given set of buildings, you must find the minimum number of bridges needed to connect all the buildings. If this is impossible, find a solution that minimizes the number of disconnected groups of buildings. Among possible solutions with the same number of bridges, choose the one that minimizes the sum of the lengths of the bridges, measured in multiples of the grid size. Two bridges may cross, but in this case they are considered to be on separate levels and do not provide a connection from one bridge to the other.
The figure below illustrates four possible city configurations. City 1 consists of five buildings that can be connected by four bridges with a total length of 4. In City 2, no bridges are possible, since no buildings share a common grid line. In City 3, no bridges are needed because there is only one building. In City 4, the best solution uses a single bridge of length 1 to connect two buildings, leaving two disconnected groups (one containing two buildings and one containing a single building).
City 1 City 1 with bridges City 2 No bridges are possible
City 3 No bridges are needed City 4 City 4 with bridges
Input
The input data set describes several rectangular cities. Each city description begins with a line containing two integers r and c, representing the size of the city on the north-south and east-west axes measured in grid lengths (1 ≤ r ≤ 50 and 1 ≤ c ≤ 50). These numbers are followed by exactly r lines, each consisting of c hash (“#”) and dot (“.”) characters. Each character corresponds to one square of the grid. A hash character corresponds to a square that is occupied by a building, and a dot character corresponds to a square that is not occupied by a building. The input data for the last city will be followed by a line containing two zeros.
Output
For each city description, print two or three lines of output as shown below. The first line consists of the city number. If the city has fewer than two buildings, the second line is the sentence “No bridges are needed.” If the city has two or more buildings but none of them can be connected by bridges, the second line is the sentence “No bridges are possible.” Otherwise, the second line is “N bridges of total length L” where N is the number of bridges and L is the sum of the lengths of the bridges of the best solution. (If N is 1, use the word “bridge” rather than “bridges.”) If the solution leaves two or more disconnected groups of buildings, print a third line containing the number of disconnected groups.
Print a blank line between cases. Use the output format shown in the example.
Sample Input
3 5
#...#
..#..
#...#
3 5
##...
.....
....#
3 5
#.###
#.#.#
###.#
3 5
#.#..
.....
....#
0 0
Sample Output
City 1
4 bridges of total length 4
City 2
No bridges are possible.
2 disconnected groups
City 3
No bridges are needed.
City 4
1 bridge of total length 1
2 disconnected groups
Problem B · Light Bulbs Input File: bulbs.in
Hollywood’s newest theater, the Atheneum of Culture and Movies, has a huge computer-operated marquee composed of thousands of light bulbs. Each row of bulbs is operated by a set of switches that are electronically controlled by a computer program. Unfortunately, the electrician installed the wrong kind of switches, and tonight is the ACM’s opening night. You must write a program to make the switches perform correctly.
A row of the marquee contains n light bulbs controlled by n switches. Bulbs and switches are numbered from 1 to n, left to right. Each bulb can either be ON or OFF. Each input case will contain the initial state and the desired final state for a single row of bulbs.
The original lighting plan was to have each switch control a single bulb. However the electrician’s error caused each switch to control two or three consecutive bulbs, as shown in Figure 1. The leftmost switch (i = 1) toggles the states of the two leftmost bulbs (1 and 2); the rightmost switch (i = n) toggles the states of the two rightmost bulbs (n – 1 and n). Each remaining switch (1 < i < n) toggles the states of the three bulbs with indices i – 1, i, and i + 1. (In the special case where there is a single bulb and a single switch, the switch simply toggles the state of that bulb.) Thus, if bulb 1 is ON and bulb 2 is OFF, flipping switch 1 will turn bulb 1 OFF and bulb 2 ON. The minimum cost of changing a row of bulbs from an initial configuration to a final configuration is the minimum number of switches that must be flipped to achieve the change.
nth switch first switch second switch third switch
Figure 1 (n-1)st bulb nth bulb third bulb second bulb first bulb
You can represent the state of a row of bulbs in binary, where 0 means the bulb is OFF and 1 means the bulb is ON. For instance, 01100 represents a row of five bulbs in which the second and third bulbs are both ON. You could transform this state into 10000 by flipping switches 1, 4, and 5, but it would be less costly to simply flip switch 2.
You must write a program that determines the switches that must be flipped to change a row of light bulbs from its initial state to its desired final state with minimal cost. Some combinations of initial and final states may not be feasible. For compactness of representation, decimal integers are used instead of binary for the bulb configurations. Thus, 01100 and 10000 are represented by the decimal integers 12 and 16.
Input
The input file contains several test cases. Each test case consists of one line. The line contains two non-negative decimal integers, at least one of which is positive and each of which contains at most 100 digits. The first integer represents the initial state of the row of bulbs and the second integer represents the final state of the row. The binary equivalent of these integers represents the initial and final states of the bulbs, where 1 means ON and 0 means OFF. To avoid problems with leading zeros, assume that the first bulb in either the initial or the final configuration (or both) is ON. There are no leading or trailing blanks in the input lines, no leading zeros in the two decimal integers, and the initial and final states are separated by a single blank.
The last test case is followed by a line containing two zeros.
Output
For each test case, print a line containing the case number and a decimal integer representing a minimum-cost set of switches that need to be flipped to convert the row of bulbs from initial state to final state. In the binary equivalent of this integer, the rightmost (least significant) bit represents the nth switch, 1 indicates that a switch has been flipped, and 0 indicates that the switch has not been flipped. If there is no solution, print “impossible”. If there is more than one solution, print the one with the smallest decimal equivalent.
Print a blank line between cases. Use the output format shown in the example.
Sample Input
12 16
1 1
3 0
30 5
7038312 7427958190
4253404109 657546225
0 0
Sample Output
Case Number 1: 8
Case Number 2: 0
Case Number 3: 1
Case Number 4: 10
Case Number 5: 2805591535
Case Number 6: impossible
Problem C · Riding the Bus Input File: bus.in
The latest research in reconfigurable multiprocessor chips focuses on the use of a single bus that winds around the chip. Processor components, which can be anywhere on the chip, are attached to connecting points on the bus so that they can communicate with each other.
Some research involves bus layout that uses recursively-defined “SZ” curves, also known as “S-shaped Peano curves.” Two examples of these curves are shown below. Each curve is drawn on the unit square. The order-1 curve, shown on the left, approximates the letter “S” and consists of line segments connecting the points (0,0), (1,0), (1,0.5), (0,0.5), (0,1), and (1,1) in order. Each horizontal line in an “S” or “Z” curve is twice as long as each vertical line. For the order-1 curve, the length of a vertical line, len, is 0.5.
1,1 1,1
len
2 × len 0,0 0,0
The order-2 curve, shown on the right, contains 9 smaller copies of the order-1 curve (4 of which are reversed left to right to yield “Z” curves). These copies are connected by line segments of length len, shown as dotted lines. Since the width and height of the order-2 curve is 8 × len, and the curve is drawn on the unit square, len = 0.125 for the order-2 curve.
The order-3 curve contains 9 smaller copies of the order-2 curve (with 4 reversed left to right), connected by line segments, as described for the order-2 curve. Higher order curves are drawn in a similar manner. The connecting points to which processor components attach are evenly spaced every len units along the bus. The first connecting point is at (0,0) and the last is at (1,1). There are 9k connecting points along the order-k curve, and the total bus length is (9k–1) × len units.
You must write a program to determine the total distance that signals must travel between two processor components. Each component’s coordinates are given as an x, y pair, 0 ≤ x ≤ 1 and 0 ≤ y ≤ 1, where x is the distance from the left side of the chip, and y is the distance from the lower edge of the chip. Each component is attached to the closest connecting point by a straight line. If multiple connecting points are equidistant from a component, the one with the smallest x coordinate and smallest y coordinate is used. The total distance a signal must travel between two components is the sum of the length of the lines connecting the components to the bus, and the length of the bus between the two connecting points. For example, the distance between components located at (0.5, 0.25) and (1.0, 0.875) on a chip using the order-1 curve is 3.8750 units.
Input
The input contains several cases. For each case, the input consists of an integer that gives the order of the SZ curve used as the bus (no larger than 8), and then four real numbers x1, y1, x2, y2 that give the coordinates of the processor components to be connected. While each processor component should actually be in a unique location not on the bus, your program must correctly handle all possible locations.
The last case in the input is followed by a single zero.
Output
For each case, display the case number (starting with 1 for the first case) and the distance between the processor components when they are connected as described. Display the distance with 4 digits to the right of the decimal point.
Use the same format as that shown in the sample output shown below. Leave a blank line between the output lines for consecutive cases.
Sample Input
1 0.5 .25 1 .875
1 0 0 1 1
2 .3 .3 .7 .7
2 0 0 1 1
0
Sample Output
Case 1.  Distance is 3.8750
Case 2.  Distance is 4.0000
Case 3.  Distance is 8.1414
Case 4.  Distance is 10.0000
Problem D · Eurodiffusion Input File: euro.in
On January 1, 2002, twelve European countries abandoned their national currency for a new currency, the euro. No more francs, marks, lires, guldens, kroner,... only euros, all over the eurozone. The same banknotes are used in all countries. And the same coins? Well, not quite. Each country has limited freedom to create its own euro coins:
“Every euro coin carries a common European face. On the obverse, member states decorate the coins with their own motif. No matter which motif is on the coin, it can be used anywhere in the 12 Member States. For example, a French citizen is able to buy a hot dog in Berlin using a euro coin with the imprint of the King of Spain.” (source: http://europa.eu.int/euro/html/entry.html)
On January 1, 2002, the only euro coins available in Paris were French coins. Soon the first non-French coins appeared in Paris. Eventually, one may expect all types of coins to be evenly distributed over the twelve participating countries. (Actually this will not be true. All countries continue minting and distributing coins with their own motifs. So even in a stable situation, there should be an excess of German coins in Berlin.) So, how long will it be before the first Finnish or Irish coins are in circulation in the south of Italy? How long will it be before coins of each motif are available everywhere?
You must write a program to simulate the dissemination of euro coins throughout Europe, using a highly simplified model. Restrict your attention to a single euro denomination. Represent European cities as points in a rectangular grid. Each city may have up to 4 neighbors (one to the north, east, south and west). Each city belongs to a country, and a country is a rectangular part of the plane. The figure below shows a map with 3 countries and 28 cities. The graph of countries is connected, but countries may border holes that represent seas, or non-euro countries such as Switzerland or Denmark. Initially, each city has one million (1000000) coins in its country’s motif. Every day a representative portion of coins, based on the city’s beginning day balance, is transported to each neighbor of the city. A representative portion is defined as one coin for every full 1000 coins of a motif.
A city is complete when at least one coin of each motif is present in that city. A country is complete when all of its cities are complete. Your program must determine the time required for each country to become complete.
Input
The input consists of several test cases. The first line of each test case is the number of countries (1 ≤ c ≤ 20). The next c lines describe each country. The country description has the format: name xl yl xh yh, where name is a single word with at most 25 characters; xl, yl are the lower left city coordinates of that country (most southwestward city ) and xh, yh are the upper right city coordinates of that country (most northeastward city). 1 ≤ xl ≤ xh ≤ 10 and 1 ≤ yl ≤ yh ≤ 10.
The last case in the input is followed by a single zero.
Output
For each test case, print a line indicating the case number, followed by a line for each country with the country name and number of days for that country to become complete. Order the countries by days to completion. If two countries have identical days to completion, order them alphabetically by name.
Use the output format shown in the example.
Sample Input
3
France  1 4 4 6
Spain          3 1 6 3
Portugal    1 1 2 2
1
Luxembourg  1 1 1 1
2
Netherlands 1 3 2 4
Belgium     1 1 2 2
0
Sample Output
Case Number 1
Spain   382
Portugal   416
France   1325
Case Number 2
Luxembourg   0
Case Number 3
Belgium   2
Netherlands   2
Problem E · Covering Whole Holes Input File: holes.in
Can you cover a round hole with a square cover? You can, as long as the square cover is big enough. It obviously will not be an exact fit, but it is still possible to cover the hole completely.
The Association of Cover Manufacturers (ACM) is a group of companies that produce covers for all kinds of holes
- manholes, holes on streets, wells, ditches, cave entrances, holes in backyards dug by dogs to bury bones, to name
only a few. ACM wants a program that determines whether a given cover can be used to completely cover a specified hole. At this time, they are interested only in covers and holes that are rectangular polygons (that is, polygons with interior angles of only 90 or 270 degrees). Moreover, both cover and hole are aligned along the same coordinate axes, and are not supposed to be rotated against each other – just translated relative to each other.
Input
The input consists of several descriptions of covers and holes. The first line of each description contains two integers h and c (4 ≤ h ≤ 50 and 4 ≤ c ≤ 50), the number of points of the polygon describing the hole and the cover respectively. Each of the following h lines contains two integers x and y, which are the vertices of the hole’s polygon in the order they would be visited in a trip around the polygon. The next c lines give a corresponding description of the cover. Both polygons are rectangular, and the sides of the polygons are aligned with the coordinate axes. The polygons have positive area and do not intersect themselves.
The last description is followed by a line containing two zeros.
Output
For each problem description, print its number in the sequence of descriptions. If the hole can be completely covered by moving the cover (without rotating it), print “Yes” otherwise print “No”. Recall that the cover may extend beyond the boundaries of the hole as long as no part of the hole is uncovered. Follow the output format in the example given below.
Sample Input
4 4
0 0
0 10
10 10
10 0
0 0
0 20
20 20
20 0
4 6
0 0
0 10
10 10
10 0
0 0
0 10
10 10
10 1
9 1
9 0
0 0
Sample Output
Hole 1: Yes
Hole 2: No
Problem F · Combining Images Input File: images.in
As the exchange of images over computer networks becomes more common, the problem of image compression takes on increasing importance. Image compression algorithms are used to represent images using a relatively small number of bits.
One image compression algorithm is based on an encoding called a “Quad Tree.” An image has a Quad Tree encoding if it is a square array of binary pixels (the value of each pixel is 0 or 1, called the “color” of the pixel), and the number of pixels on the side of the square is a power of two.
If an image is homogeneous (all its pixels are of the same color), the Quad Tree encoding of the image is 1 followed by the color of the pixels. For example, the Quad Tree encoding of an image that contains pixels of color 1 only is 11, regardless of the size of the image.
If an image is heterogeneous (it contains pixels of both colors), the Quad Tree encoding of the image is 0 followed by the Quad Tree encodings of its upper-left quadrant, its upper-right quadrant, its lower-left quadrant, and its lower-right quadrant, in order.
The Quad Tree encoding of an image is a string of binary digits. For easier printing, a Quad Tree encoding can be converted to a Hex Quad Tree encoding by the following steps: a. Prepend a 1 digit as a delimiter on the left of the Quad Tree encoding. b. Prepend 0 digits on the left as necessary until the number of digits is a multiple of four. c. Convert each sequence of four binary digits into a hexadecimal digit, using the digits 0 to 9 and capital A through F to represent binary patterns from 0000 to 1111.
For example, the Hex Quad Tree encoding of an image that contains pixels of color 1 only is 7, which corresponds to the binary string 0111.
You must write a program that reads the Hex Quad Tree encoding of two images, computes a new image that is the intersection of those two images, and prints its Hex Quad Tree encoding. Assume that both input images are square and contain the same number of pixels (although the lengths of their encodings may differ). If two images A and B have the same size and shape, their intersection (written as A & B) also has the same size and shape. By definition, a pixel of A & B is equal to 1 if and only if the corresponding pixels of image A and image B are both equal to 1.
The following figure illustrates two input images and their intersection, together with the Hex Quad Tree encodings of each image. In the illustration, shaded squares represent pixels of color 1.
& =
2BA 2BB 2FA
Input
The input data set contains a sequence of test cases, each of which is represented by two lines of input. In each test case, the first input line contains the Hex Quad Tree encoding of the first image and the second line contains the Hex Quad Tree encoding of the second image. For each input image, the number of hexadecimal digits in its Hex Quad Tree encoding will not exceed 100. The last test case is followed by two input lines, each containing a single zero.
Output
For each test case, print “Image” followed by its sequence number. On the next line, print the Hex Quad Tree encoding of the intersection of the two images for that test case. Separate the output for consecutive test cases with a blank line.
Sample Input
2FA
2BB
2FB
2EF
7
2FA
0
0
Sample Output
Image 1:
2BA
Image 2:
2EB
Image 3:
2FA
Problem G · A Linking Loader Input File: linker.in
An object module is produced by a compiler as a result of processing a source program. A linking loader (or just a linker) is used to combine the multiple object modules used when a program contains several separately compiled modules. Two of its primary tasks are to relocate the code and data in each object module (since the compiler does not know where in memory a module will be placed), and to resolve symbolic references from one module to another. For example, a main program may reference a square root function called sqrt, and that function may be defined in a separate source module. The linker will then minimally have to assign addresses to the code and data in each module, and put the address of the sqrt function in the appropriate location(s) in the main module’s code.
An object module contains (in order) zero or more external symbol definitions, zero or more external symbol references, zero or more bytes of code and data (that may include references to the values of external symbols), and an end of module marker. In this problem, an object module is represented as a sequence of text lines, each beginning with a single uppercase character that characterizes the remainder of the line. The format of each of these lines is as follows. Whitespace (one or more blanks and/or tab characters) will appear between the fields in these lines. Additional whitespace may follow the last field in each line.
-
A line of the form “D symbol offset” is an external symbol definition. It defines symbol as having the address offset bytes greater than the address where the first byte of code and data for the current object module is located by the linker. A symbol is a string of no more than eight upper case alphabetic characters. The offset is a hexadecimal number with no more than four digits (using only upper case alphabetic characters for the digits A through F). For example, in a module that is loaded starting at the address 10016, the line “D START 5C” indicates that the symbol START is defined as being associated with the address 15C16. The number of D lines in a test case is at most 100.
-
A line of the form “E symbol” is an external symbol reference, and indicates that the value of symbol (presumably defined in another object module) may be referenced as part of the code and data for the current module. For example, the line “E START” indicates that the value of the symbol START (that is, the address defined for it) may be used as part of the code and data for the module. Each of the “E” lines for each module is numbered sequentially, starting with 0, so they can be referenced in the “C” lines.
-
A line of the form “C n byte1 byte2 … byten” specifies the first or next n bytes of code and data for the current module. The value n is specified as a one or two digit hexadecimal number, and will be no larger than 10 hexadecimal. Each byte is either a one or two digit hexadecimal number, or a dollar sign. The first byte following a dollar sign (always on the same line) gives the 0-origin index of an external symbol reference for this module, and identifies the symbol which is to have its 16-bit value inserted at the current point in the linked program (that is, in the location indicated by the dollar sign and the following byte). The high-order byte is placed in the location indicated by the dollar sign. The values specified for the other bytes (those not following a dollar sign) are loaded into sequential memory locations, starting with the first (lowest) unused memory location. For example, the line “C 4 25 $ 0 37” would cause the values 2516 0116 5C16 and 3716 to be placed in the next four unused memory locations, assuming the first “E” line for the current module specified a symbol defined as having the address 15C16. If the 0-origin index of the external symbol reference is an undefined symbol, the 16-bit value inserted at the current point in the linked program is 000016.
-
A line of the form “Z” marks the end of an object module.
You may assume that no address requires more than four hexadecimal digits. Lines are always given in the order shown above. There are no syntax errors in the input.
Input
This problem has multiple input cases. The input for each case is one or more object modules, in sequence, that are to be linked, followed by a line beginning with a dollar sign. The first address at which code is to be loaded in each case is 10016.
The last case will be followed by a line containing only a dollar sign.
Output
For each case, print the case number (starting with 1), the 16-bit checksum of the loaded bytes (as described below), and the load map showing the address of each externally defined or referenced symbol, in ascending order of symbol name. For undefined symbols, print the value as four question marks, but use zero as the symbol’s value when it is referenced in “C” lines. If a symbol is defined more than once, print “M” following the address shown in the load map, and use the value from the first definition encountered in any object module to satisfy external references. Format the output exactly as shown in the samples.
The 16-bit checksum is computed by first setting it to zero. Then, for each byte assigned to a memory location by the loader, in increasing address order, circularly left shift the checksum by one bit, and add the byte from the memory location, discarding any carry out of the low-order 16 bits.
Sample Input
D MAIN 0
D END 5
C 03 01 02 03
C 03 04 05 06
Z
$
D ENTRY 4
E SUBX
E SUBY
C 10 1 2 3 4 5 $ 0 6 7 8 9 A B C D E
C 8 10 20 30 40 50 60 70 80
C 8 90 A0 B0 C0 D0 E0 $ 1
C 5 $ 0 FF EE DD
Z
D SUBX 01
C 06 A B C D E F
Z
D SUBX 05
C 06 51 52 53 54 55 56
Z
$
$
Sample Output
Case 1: checksum = 0078 SYMBOL ADDR -------- ---- END 0105 MAIN 0100 Case 2: checksum = 548C SYMBOL ADDR -------- ---- ENTRY 0104 SUBX 0126 M SUBY ????-
Problem H · A Spy in the Metro Input File: metro.in
Secret agent Maria was sent to Algorithms City to carry out an especially dangerous mission. After several thrilling events we find her in the first station of Algorithms City Metro, examining the time table. The Algorithms City Metro consists of a single line with trains running both ways, so its time table is not complicated.
Maria has an appointment with a local spy at the last station of Algorithms City Metro. Maria knows that a powerful organization is after her. She also knows that while waiting at a station, she is at great risk of being caught. To hide in a running train is much safer, so she decides to stay in running trains as much as possible, even if this means traveling backward and forward. Maria needs to know a schedule with minimal waiting time at the stations that gets her to the last station in time for her appointment. You must write a program that finds the total waiting time in a best schedule for Maria.
The Algorithms City Metro system has N stations, consecutively numbered from 1 to N. Trains move in both directions: from the first station to the last station and from the last station back to the first station. The time required for a train to travel between two consecutive stations is fixed since all trains move at the same speed. Trains make a very short stop at each station, which you can ignore for simplicity. Since she is a very fast agent, Maria can always change trains at a station even if the trains involved stop in that station at the same time.
second station Nth station first station
Input
The input file contains several test cases. Each test case consists of seven lines with information as follows.
Line 1. The integer N (2 ≤ N ≤ 50), which is the number of stations. Line 2. The integer T (0 ≤ T ≤ 200), which is the time of the appointment. Line 3. N-1 integers: t1, t2, ... tN-1 (1 ≤ ti ≤ 20), representing the travel times for the trains between two consecutive stations: t1 represents the travel time between the first two stations, t2 the time between the second and the third station, and so on. Line 4. The integer M1 (1 ≤ M1 ≤ 50), representing the number of trains departing from the first station. Line 5. M1 integers: d1, d2, ... dM1 (0 ≤ di ≤ 250 and di < di+1), representing the times at which trains depart from the first station. Line 6. The integer M2 (1 ≤ M2 ≤ 50), representing the number of trains departing from the Nth station. Line 7. M2 integers: e1, e2, ... eM2 (0 ≤ ei ≤ 250 and ei < ei+1) representing the times at which trains depart from the Nth station.
The last case is followed by a line containing a single zero.
Output
For each test case, print a line containing the case number (starting with 1) and an integer representing the total waiting time in the stations for a best schedule, or the word “impossible” in case Maria is unable to make the appointment. Use the format of the sample output.
Sample Input
4
55
5 10 15
4
0 5 10 20
4
0 5 10 15
4
18
1 2 3
5
0 3 6 10 12
6
0 3 5 7 12 15
2
30
20
1
20
7
1 3 5 7 11 13 17
0
Sample Output
Case Number 1: 5
Case Number 2: 0
Case Number 3: impossible
Problem I · The Solar System Input File: solar.in
It is common knowledge that the Solar System consists of the sun at its center and nine planets moving around the sun on elliptical orbits. Less well known is the fact that the planets’ orbits are not at all arbitrary. In fact, the orbits obey three laws discovered by Johannes Kepler. These laws, also called “The Laws of Planetary Motion,” are the following.
- The orbits of the planets are ellipses, with the sun at one focus of the ellipse. (Recall that the two foci of an ellipse are such that the sum of the distances to them is the same for all points on the ellipse.) 2. The line joining a planet to the sun sweeps over equal areas during equal time intervals as the planet travels around the ellipse. 3. The ratio of the squares of the revolutionary periods of two planets is equal to the ratio of the cubes of their semi major axes.
By Kepler’s first law, the path of the planet shown in the figure on the left is an ellipse. According to Kepler’s second law, if the planet goes from M to N in time tA and from P to Q in time tB and if tA= tB, then area A equals area B. Kepler’s third law is illustrated next.
Consider an ellipse whose center is at the origin O and that is symmetric with respect to the two coordinate axes. The x-axis intersects the ellipse at points A and B and the y-axis intersects the ellipse at points C and D. Set a=½|AB| and b=½|CD|. Then the ellipse is defined by the equation x2/a2+y2/b2=1. If a ≥ b, AB is called the major axis, CD the minor axis, and OA (with length a) is called the semi major axis. When two planets are revolving around the sun in times t1 and t2 respectively, and the semi major axes of their orbits have lengths a1 and a2, then according to Kepler’s third law (t1/t2)2 = (a1/a2)3.
In this problem, you are to compute the location of a planet using Kepler’s laws. You are given the description of one planet in the Solar System (i.e., the length of its semi-major axis, semi-minor axis, and its revolution time) and the description of a second planet (its semi-major axis and semi-minor axis). Assume that the second planet’s orbit is aligned with the coordinate axes (as in the above figure), that it moves in counter clockwise direction, and that the sun is located at the focal point with non-negative x-coordinate. You are to compute the position of the second planet a specified amount of time after it starts at the point with maximal x-coordinate on its orbit (point B in the above figure).
Input
The input file contains several descriptions of pairs of planets. Each line contains six integers a1, b1, t1, a2, b2, t. The first five integers are positive, and describe two planets as follows: a1 = semi major axis of the first planet’s orbit b1 = semi minor axis of the first planet’s orbit t1 = period of revolution of the first planet (in days) a2 = semi major axis of the second planet’s orbit b2 = semi minor axis of the second planet’s orbit
The non-negative integer t is the time (in days) at which you have to determine the position of the second planet, assuming that the planet starts in position (a2,0).
The last description is followed by a line containing six zeros.
Output
For each pair of planets described in the input, produce one line of output. For each line, print the number of the test case. Then print the x- and y-coordinates of the position of the second planet after t days. These values must be exact to three digits to the right of the decimal point. Follow the format of the sample output provided below.
Sample Input
10 5 10 10 5 10
10 5 10 20 10 10
0 0 0 0 0 0
Sample Output
Solar System 1: 10.000 0.000
Solar System 2: -17.525 4.819
Problem J · Toll Input File: toll.in
Sindbad the Sailor sold 66 silver spoons to the Sultan of Samarkand. The selling was quite easy; but delivering was complicated. The items were transported over land, passing through several towns and villages. Each town and village demanded an entry toll. There were no tolls for leaving. The toll for entering a village was simply one item. The toll for entering a town was one piece per 20 items carried. For example, to enter a town carrying 70 items, you had to pay 4 items as toll. The towns and villages were situated strategically between rocks, swamps and rivers, so
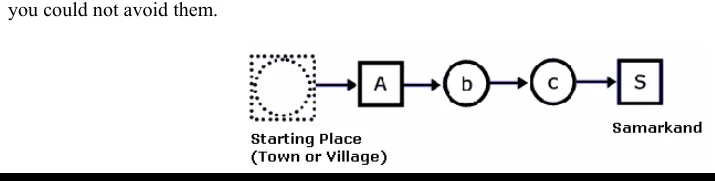
Figure 1: To reach Samarkand with 66 spoons, traveling through a town followed by two villages, you must start with 76 spoons.
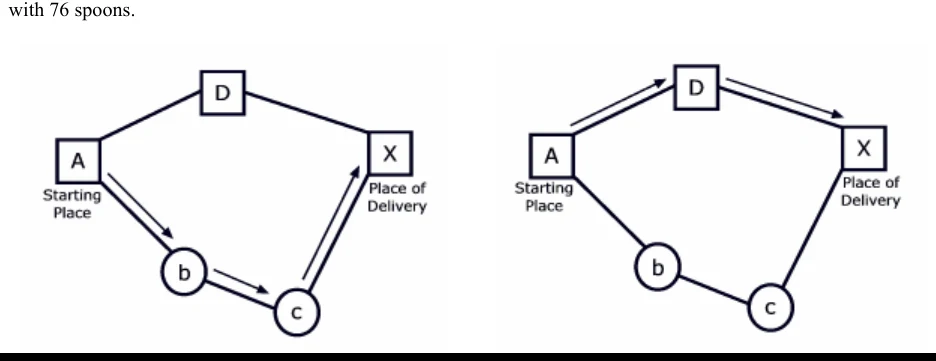
Figure 2: The best route to reach X with 39 spoons, starting from A, is A→b→c→X, shown with arrows in the figure on the left. The best route to reach X with 10 spoons is A→D→X, shown in the figure on the right. The figures display towns as squares and villages as circles.
Predicting the tolls charged in each village or town is quite simple, but finding the best route (the cheapest route) is a real challenge. The best route depends upon the number of items carried. For numbers up to 20, villages and towns charge the same. For large numbers of items, it makes sense to avoid towns and travel through more villages, as illustrated in Figure 2.
You must write a program to solve Sindbad’s problem. Given the number of items to be delivered to a certain town or village and a road map, your program must determine the total number of items required at the beginning of the journey that uses a cheapest route.
Input
The input consists of several test cases. Each test case consists of two parts: the roadmap followed by the delivery details.
The first line of the roadmap contains an integer n, which is the number of roads in the map (0 ≤ n). Each of the next n lines contains exactly two letters representing the two endpoints of a road. A capital letter represents a town; a lower case letter represents a village. Roads can be traveled in either direction.
Following the roadmap is a single line for the delivery details. This line consists of three things: an integer p (0 < p ≤ 1000) for the number of items that must be delivered, a letter for the starting place, and a letter for the place of delivery. The roadmap is always such that the items can be delivered.
The last test case is followed by a line containing the number -1.
Output
The output consists of a single line for each test case. Each line displays the case number and the number of items required at the beginning of the journey. Follow the output format in the example given below.
Sample Input
1
a Z
19 a Z
5
A D
D X
A b
b c
c X
39 A X
-1
Sample Output
Case 1: 20
Case 2: 44